GPU-Accelerated Graph Analytics for Irregular Security Graphs
A reproducible empirical study of GPU acceleration strategies (BFS, PageRank, WCC, Louvain) on skewed, power-law graphs — five optimization tiers from sequential C++ to load-balanced CUDA, benchmarked from 8M to 268M edges, with every speedup attributed to one named technique and every negative result kept.
Project Background
Many problems in my field produce graphs with the same difficult shape: power-law, highly imbalanced degree distributions. A binary’s call-graph has a handful of hot helper functions called from everywhere while most functions are called once; a network-flow graph for intrusion detection has a few scanning hosts touching thousands of peers while most hosts touch a handful. On a GPU this imbalance is exactly what wrecks performance — one thread grinds through a hub with hundreds of thousands of edges while its 31 warp-mates sit idle.
This project is a reproducible empirical study — not a claim of a new algorithm — of how the standard GPU-acceleration techniques behave on these irregular security graphs. Four classic graph algorithms are implemented at every optimization tier so each speedup is attributable to a specific technique, and every GPU number is reported against both a single CPU core and a full 8-core CPU — never just one core.
The study’s central result turned out to be methodological: a CPU-versus-GPU verdict quoted without the problem size is not a result. The same code, unchanged, loses to the CPU on a 33M-edge graph and doubles it on a 268M-edge one.
Code: github.com/Emad-Mahmodi/gpu-graph-study
Algorithms × Optimization Tiers
Every algorithm is implemented at each tier, so a speedup can be traced to one technique rather than a rewrite. The sequential tier doubles as a correctness oracle — every faster tier, including all GPU kernels on a 254-level high-diameter case, is diffed against it in CI.
| Algorithm | T0 · Seq C++ | T1 · OpenMP | T2 · Naïve CUDA | T3 · Optimized | T4 · Load-balanced |
|---|---|---|---|---|---|
| BFS | ✅ | ✅ | ✅ | ✅ | ✅ |
| PageRank | ✅ | ✅ | ✅ | ✅ | ✅ |
| Connected Components (WCC) | ✅ | ✅ | ✅ | ✅ | ✅ |
| Community Detection (Louvain) | ✅ | ✅† | ✅† | ✅† | ✅† |
- T0 Sequential — the correctness oracle.
- T1 OpenMP — multi-core CPU baseline (8 threads).
- T2 Naïve CUDA — one thread per vertex, CSR in global memory: the honest starting point.
- T3 Optimized CUDA — block-level parallel reductions, precomputed inverse degree, frontier / active-set traversal.
- T4 Load-balanced — degree-bucketed scheduling (thread / warp / block per vertex), documented as an established technique (Gunrock/Merrill), not a novel contribution.
† Louvain is the one algorithm whose parallel tiers cannot return the oracle’s answer — sequential Louvain is order-dependent by construction — so they are contracted on community quality rather than on equality, and their speed is never quoted without their modularity. See the Louvain section below.
Headline Result — the verdict is a property of problem size, not hardware
Every earlier phase of this study was measured at one graph size, 33.5M edges, where a strong 8-core i7 beat an entry-level 4 GB T600 almost everywhere. That left the most important question unanswered: was that a fact about the hardware, or about the problem size? A GPU carries fixed costs — host↔device transfer, kernel launches, a host sync per round — and a small graph never gives it enough work to amortize them.
So the whole tier stack was re-run across RMAT 2¹⁸ → 2²³ — 8.4M to 268M directed edges (8.4M vertices, max degree 486,556 at the top end) — every tier at every size, in a single session.
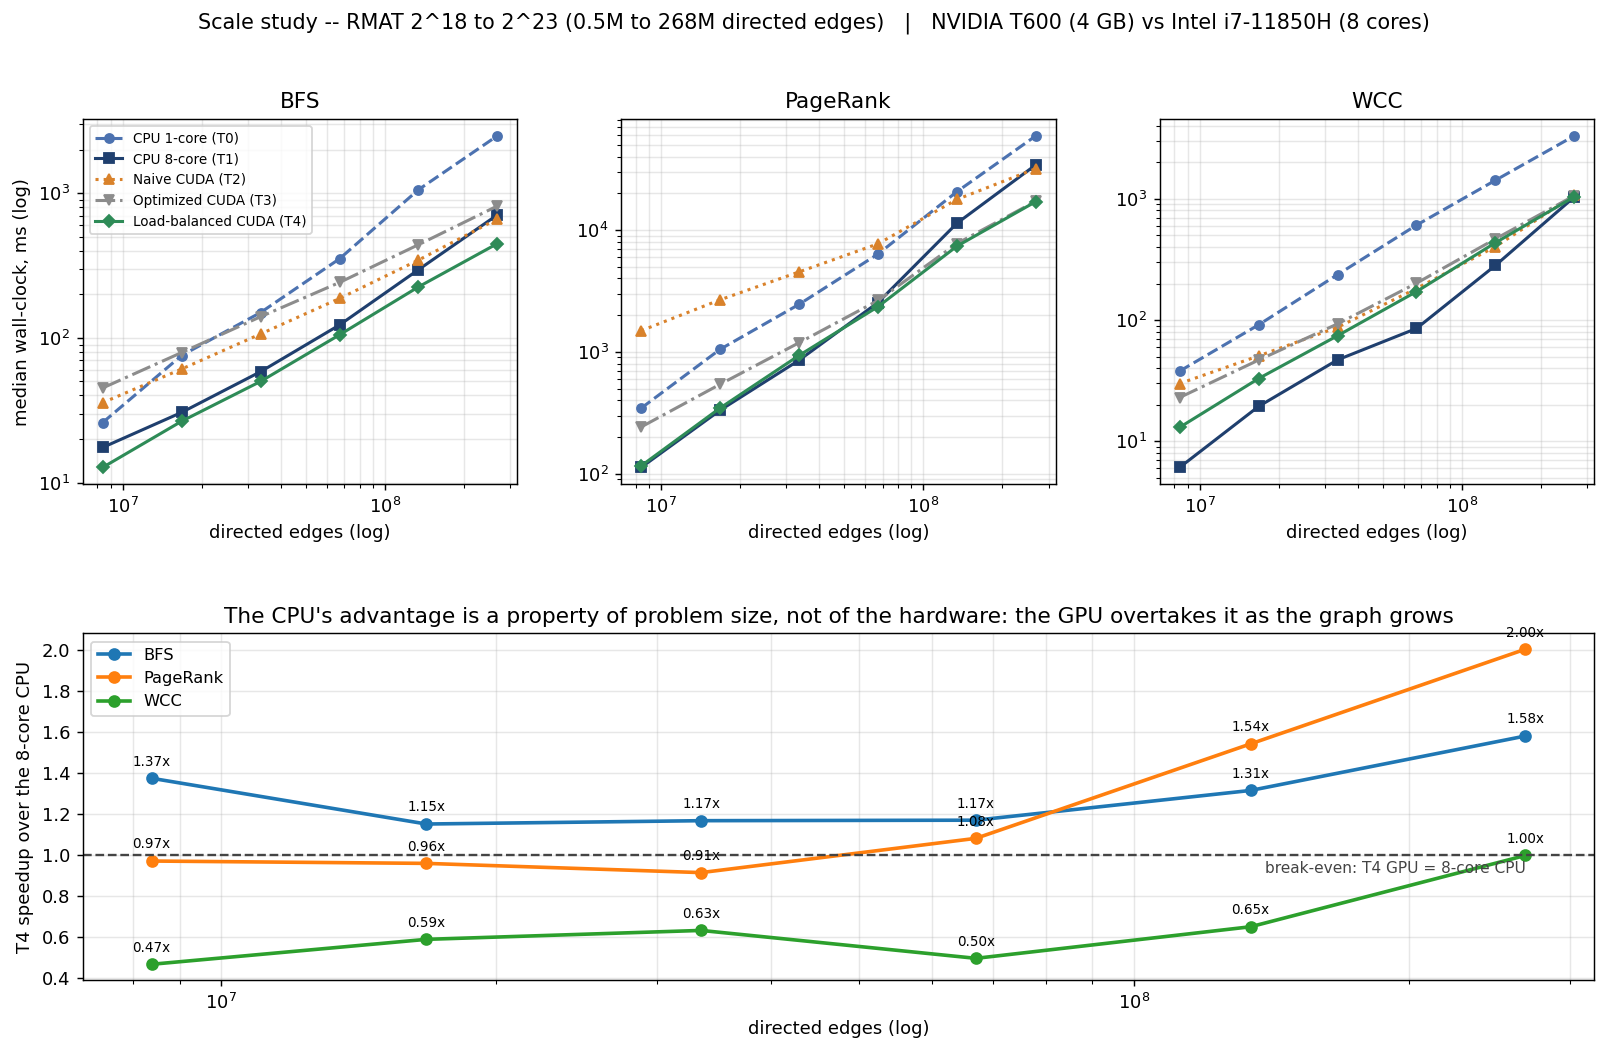
Best GPU tier (T4) against the full 8-core CPU:
| Directed edges | 8.4M | 16.8M | 33.5M | 67.1M | 134M | 268M |
|---|---|---|---|---|---|---|
| BFS | 1.37× | 1.15× | 1.17× | 1.17× | 1.31× | 1.58× |
| PageRank | 0.97× | 0.96× | 0.91× | 1.08× | 1.54× | 2.00× |
| WCC | 0.47× | 0.59× | 0.63× | 0.50× | 0.65× | 1.00× |
The answer is unambiguous. PageRank crosses over at 67M edges and reaches 2.00× the 8-core CPU at 268M — having been a 0.91× loss at the size this study used to report. Nothing about the code changed between those two numbers; only the graph grew. WCC climbs steadily and lands at exactly break-even at 268M, so the honest reading is that its crossover sits just past what a 4 GB card can hold — not that it does not exist.
Two corollaries worth stating plainly, because both cut against the usual framing:
- Naïve CUDA never justifies itself. T2 only reaches the 8-core CPU at 268M edges — the size at which the optimized tiers are already at 1.6–2.0×. Writing the obvious GPU port and stopping there yields a slower program than the CPU on every graph tested here.
- The entry-level card is not the limitation people assume. A 4 GB T600 is about as modest as a discrete CUDA GPU gets, and it still doubles a strong 8-core CPU on PageRank once the graph is large enough to keep it busy.
Technique attribution — the PageRank optimization ladder
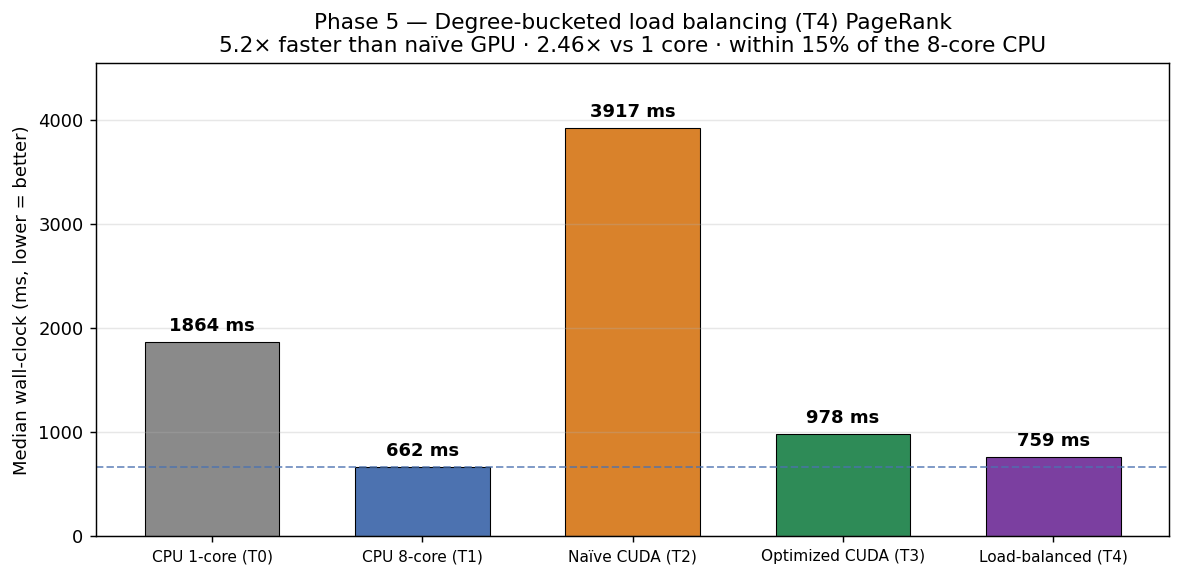
The clearest attribution story in the study. Naïve GPU PageRank loses — its two per-iteration reductions are single-address atomics that all N threads fight over. Each optimization removes one named bottleneck, and the gains compound. Measured on a power-law RMAT graph (2²⁰ vertices, 33.5M edges, max degree 138,626), median of 10 runs.
| PageRank tier | Median time | vs 1 core | vs naïve GPU |
|---|---|---|---|
| CPU 1-core (T0) | 1863.8 ms | 1.00× | — |
| CPU 8-core (T1) | 662.2 ms | 2.81× | — |
| Naïve CUDA (T2) | 3917.5 ms | 0.48× | 1.00× |
| Optimized CUDA (T3) | 978.4 ms | 1.90× | 4.00× |
| Load-balanced CUDA (T4) | 758.7 ms | 2.46× | 5.16× |
Two techniques, each attributable: T3 = parallel reduction (fixes the write/reduce), T4 = degree-bucketed scheduling (fixes the read/gather). The third bucket level — a whole block per extreme hub — was implemented, measured to give no gain on this graph, and kept as a documented point of diminishing returns: RMAT’s power-law tail holds too few very-high-degree vertices for it to matter.
Key Finding — two optimizations, two independent graph properties
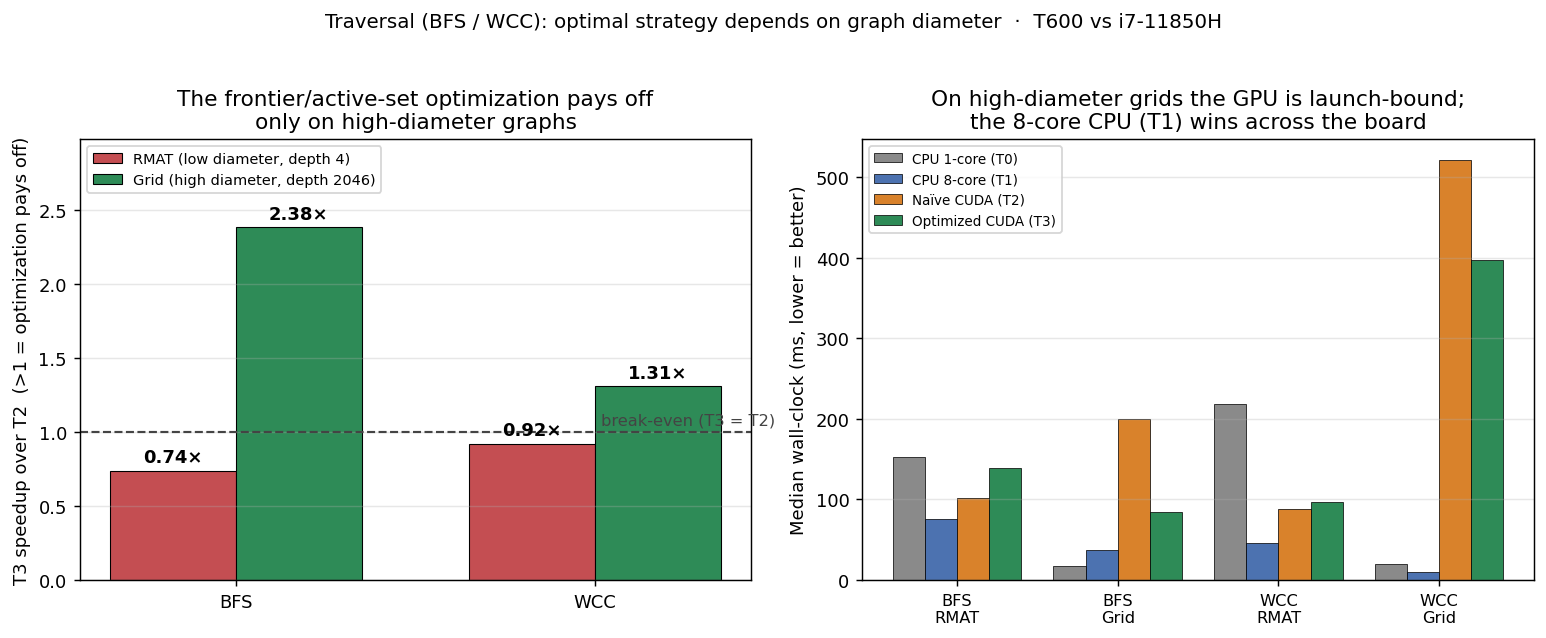
The traversal algorithms produced the study’s most transferable result: T3 and T4 are each a win in one regime and a measured loss in the other, and the deciding properties are different.
T3 depends on graph diameter
The T3 “only launch active vertices” optimizations (frontier worklist for BFS, active-set label propagation for WCC) are not unconditional wins. Whether they pay off depends on how big the frontier is — which the diameter sets. So both regimes were measured: a shallow power-law RMAT graph (BFS depth 4) and a high-diameter 2D grid (depth 2046).
T4 depends on degree skew
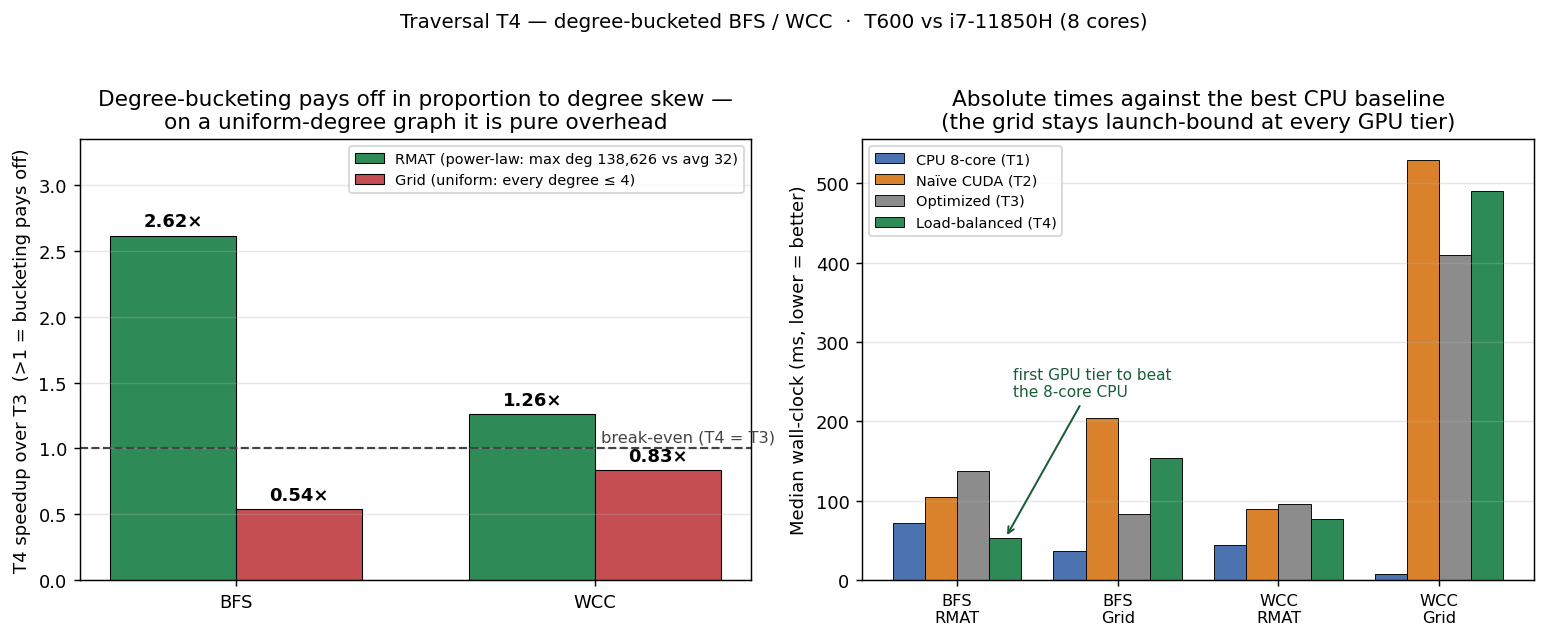
Degree-bucketing is the mirror image: it pays in proportion to how imbalanced the per-vertex work is, and costs where degrees are uniform.
| Algorithm | Graph | Naïve (T2) | Optimized (T3) | Bucketed (T4) | T4 vs T3 |
|---|---|---|---|---|---|
| BFS | RMAT — max degree 138,626 | 104.1 ms | 137.8 ms | 52.6 ms | 2.62× |
| BFS | Grid — every degree ≤ 4 | 204.3 ms | 82.8 ms | 154.1 ms | 0.54× |
| WCC | RMAT — max degree 138,626 | 89.0 ms | 96.2 ms | 76.3 ms | 1.26× |
| WCC | Grid — every degree ≤ 4 | 529.5 ms | 409.2 ms | 490.6 ms | 0.83× |
The BFS/RMAT row is the cleanest attribution in the repository. T3 alone was a loss on that graph (0.76× vs naïve); it is the degree-bucketing alone that turns it into a win, and into the first GPU tier here to beat the full 8-core CPU (52.6 ms vs 72.4 ms). Load imbalance, not the frontier, was the binding constraint all along.
Why this matters for the domain: security graphs — call-graphs, network-flow graphs — are shallow and skewed. That is precisely the regime where T3 loses and T4 wins. This is a concrete, testable recommendation for the domain, rather than a generic “use a GPU”.
Louvain — the algorithm that resists parallelism
The other three algorithms have parallel tiers that return the same answer as the oracle. Louvain cannot, and claiming otherwise would be dishonest. Sequential Louvain is Gauss-Seidel: it moves one vertex at a time and every move is immediately visible to the next, so the result is a function of the visiting order. Any parallel formulation gives that up.
On the CPU (T1) the parallel version decides from a shared snapshot, with each pass split into a few sequential chunks so later chunks see earlier moves. The chunk count is a direct quality/speed dial, and the knee is unambiguous:
| chunks per pass | time | quality vs oracle | speedup |
|---|---|---|---|
| 1 (pure simultaneous) | 240 ms | 72.6% | 7.67× |
| 4 (shipped) | 507 ms | 93.6% | 3.63× |
| 16 | 900 ms | 94.1% | 2.05× |
| 64 | 1868 ms | 96.2% | 0.99× |
| 256 | 2860 ms | 96.6% | 0.64× |
Going from 1 to 4 chunks buys 21 points of community quality for a 2.1× slowdown; 4 to 16 buys half a point for another 1.8×. Past 64 the “parallel” tier is slower than the single-core oracle it exists to accelerate. Shipping the pure-simultaneous version for its 7.67× headline would mean quietly returning communities a quarter worse than the reference.
On the GPU, the naïve tier applies every move simultaneously — and independently reproduced that same quality figure:
| implementation | accumulator | hardware | quality vs oracle | |
|---|---|---|---|---|
| CPU, 1 chunk | OpenMP | dense array per thread | i7-11850H | 72.6% |
| GPU, T2 | CUDA | global sort + segmented reduce | T600 | 73.9% |
Two implementations sharing no code, two different accumulator strategies, two different processors — the same number. That is the useful kind of confirmation: the quality loss belongs to the simultaneous-update formulation, not to any one implementation.
The three GPU tiers share an accept rule and therefore return identical modularity (a CI assertion), which is what makes their run times directly comparable:
| RMAT scale | T0 oracle | T1 · 8 threads | T2 | T3 | T4 | T4 vs 1 core | T4 vs 8-core CPU |
|---|---|---|---|---|---|---|---|
| 2¹⁶ | 712 ms | 189 ms | 156 ms | 142 ms | 111 ms | 6.42× | 1.70× |
| 2¹⁷ | 1612 ms | 463 ms | 285 ms | 278 ms | 220 ms | 7.34× | 2.10× |
| 2¹⁸ | 4211 ms | 741 ms | 533 ms | 516 ms | 412 ms | 10.22× | 1.80× |
Two negative results I kept
T3 attacked the wrong thing twice. The first attempt replaced the global sort with cub’s segmented sort, one segment per CSR row — structurally the obvious improvement, and a clear loss at 0.46–0.57×, because segmented radix sort pays a cost per segment and this graph has hundreds of thousands of them averaging 32 entries. The second kept a global sort but bounded it to the bits a key can actually occupy, and won by only 1.02–1.12×. Two optimizations of one phase with almost no effect is a signal, so I instrumented the tiers per phase instead of tuning further on instinct:
| phase | T2 | T3 | T4 |
|---|---|---|---|
| grouping (build + choose) | 277.5 ms (68%) | 216.9 ms (63%) | 131.5 ms (51%) |
| modularity guard | 40.4 ms | 35.8 ms | 35.1 ms |
| aggregation (shared code) | 91.1 ms | 91.6 ms | 89.7 ms |
| total | 408.9 ms | 344.3 ms | 256.4 ms |
Grouping was dominant; T3 did cut it 22%, but the untouched aggregation and guard held the total gain to 11% by Amdahl’s law. Aggregation is deliberately identical code in every tier, and its flat 91 / 92 / 90 ms is the control proving the difference is the grouping and nothing else.
T4’s first version degraded with density. It sized its hash table by degree bucket — 64 slots low, a fixed 2048 mid — and looked like a wash on the default graph. Sweeping density before shipping found it not merely failing to scale but collapsing to 0.44× at average degree 256. The reason: clearing and scanning a table costs its capacity, not the vertex’s degree, so raising density pushes vertices out of the cheap 64-slot bucket into the fixed 2048-slot one, where a degree-100 vertex clears and scans 2048 entries to store 100. The fix is one line of intent — the bucket picks the hardware, the vertex’s own degree picks the capacity — and it turned 0.44× into 1.18×, with T4 winning across the whole density range. That sweep is a committed script precisely because the failure is invisible at the default density.
An honest bottom line
The candid version of this study’s result changed as the evidence came in, and the change is the point.
At the single graph size the earlier phases used, the multi-core CPU was the sensible default and I said so. The scale study showed that verdict was a statement about problem size, not about the hardware: on a 268M-edge graph the same unchanged kernels reach 2.00× the 8-core CPU on PageRank and 1.58× on BFS, and Louvain’s T4 reaches 1.80×. The useful formulation is therefore conditional, not absolute — below roughly 60M edges on this hardware, use the CPU; above it, the optimized GPU tiers win, and the naïve one never does.
What I consider the transferable contributions:
- Technique attribution. Each speedup is tied to one named optimization, measured against the tier immediately below it, never to a rewrite.
- Two independent crossover findings. T3’s payoff is set by diameter, T4’s by degree skew — with each measured as a loss in the other regime rather than quietly omitted.
- The size-dependence of the whole verdict, measured across a 32× range rather than asserted.
- Negative results kept in the record: naïve CUDA never paying off, the block-per-hub level saturating, segmented sort losing, and the bucket-sized hash table degrading with density.
- Quality reported alongside speed wherever the parallel result is not identical to the oracle — Louvain’s ~73% GPU modularity is printed next to its 10.22× every time.
Domain Bridge — Real Binary Graphs
The analytics engine is domain-agnostic: it consumes a graph in CSR form and never parses a binary or a packet. A companion extractor turns a real symbol-bearing binary into a call-graph (functions → vertices, call instructions → edges) that the same engine analyzes — so one codebase spans both binary-analysis and network-security graphs, tying the systems/HPC work directly to my reverse-engineering background.
Engineering & Reproducibility
Built in raw C++17/CUDA with CMake (MSVC and GCC; CPU-only builds fall back gracefully with no GPU present). The project ships:
- a CI-gated correctness suite — every GPU kernel validated against the sequential oracle, including a 254-level high-diameter case and a dense graph that exercises every hash-table bucket;
- a deterministic RMAT generator (same seed → same graph, so every tier sees identical input) and a 2D-grid generator for the diameter study;
- a median-of-N timing harness, with GPU timings end-to-end including host↔device transfer;
- per-phase profiling (
GGS_LOUVAIN_PROFILE=1) that attributes time to grouping, guard and aggregation, so optimization targets are measured rather than guessed; - committed result CSVs and Python figure scripts that read those CSVs rather than carrying hard-coded numbers, so text and charts cannot silently drift apart.
Two methodology rules the repository holds itself to: no table mixes numbers from different measurement sessions, and no parallel result is reported without the check that it still matches the oracle — or, where it structurally cannot, without its quality alongside its speed.
Full methodology, tier-by-tier code, roadmap, and results: github.com/Emad-Mahmodi/gpu-graph-study